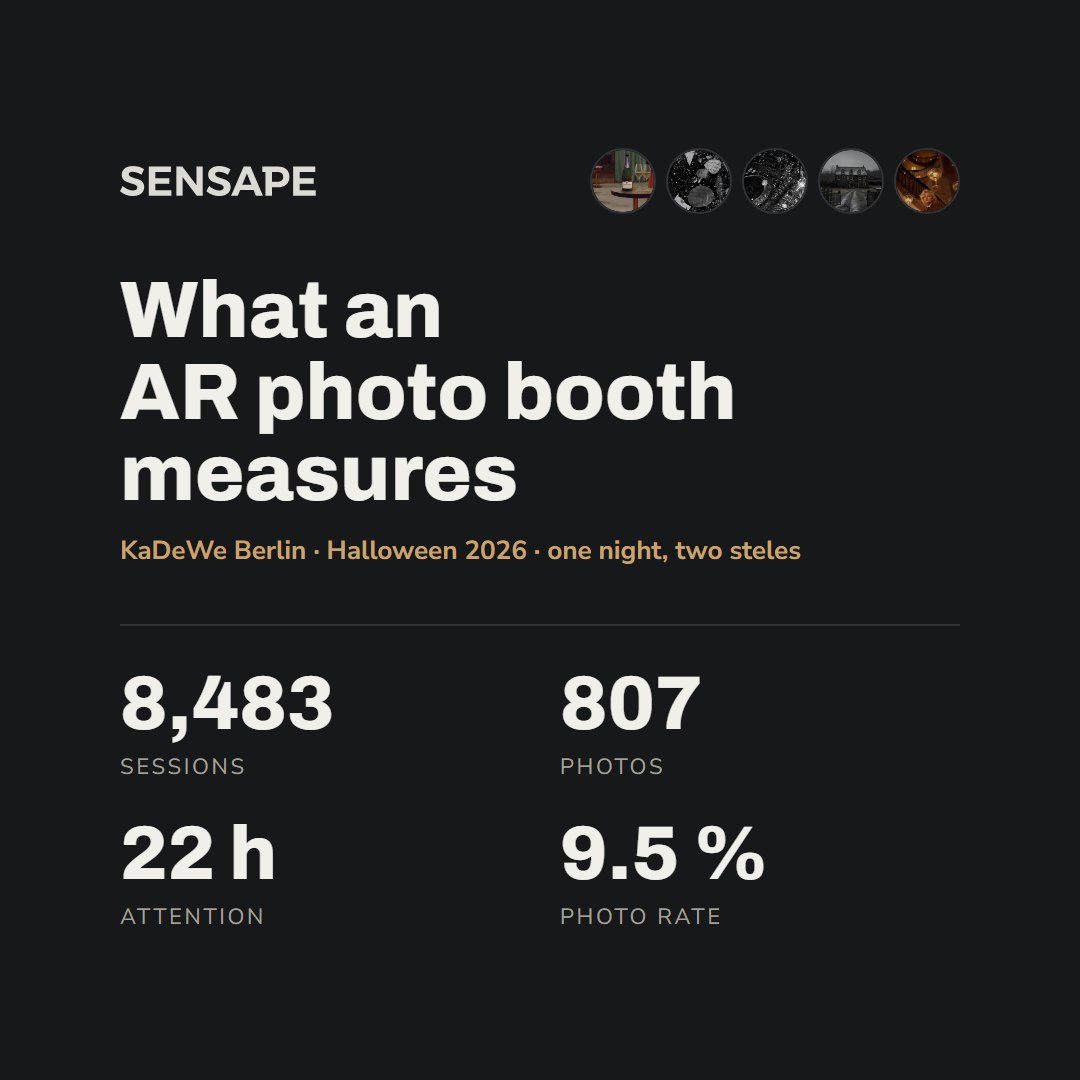


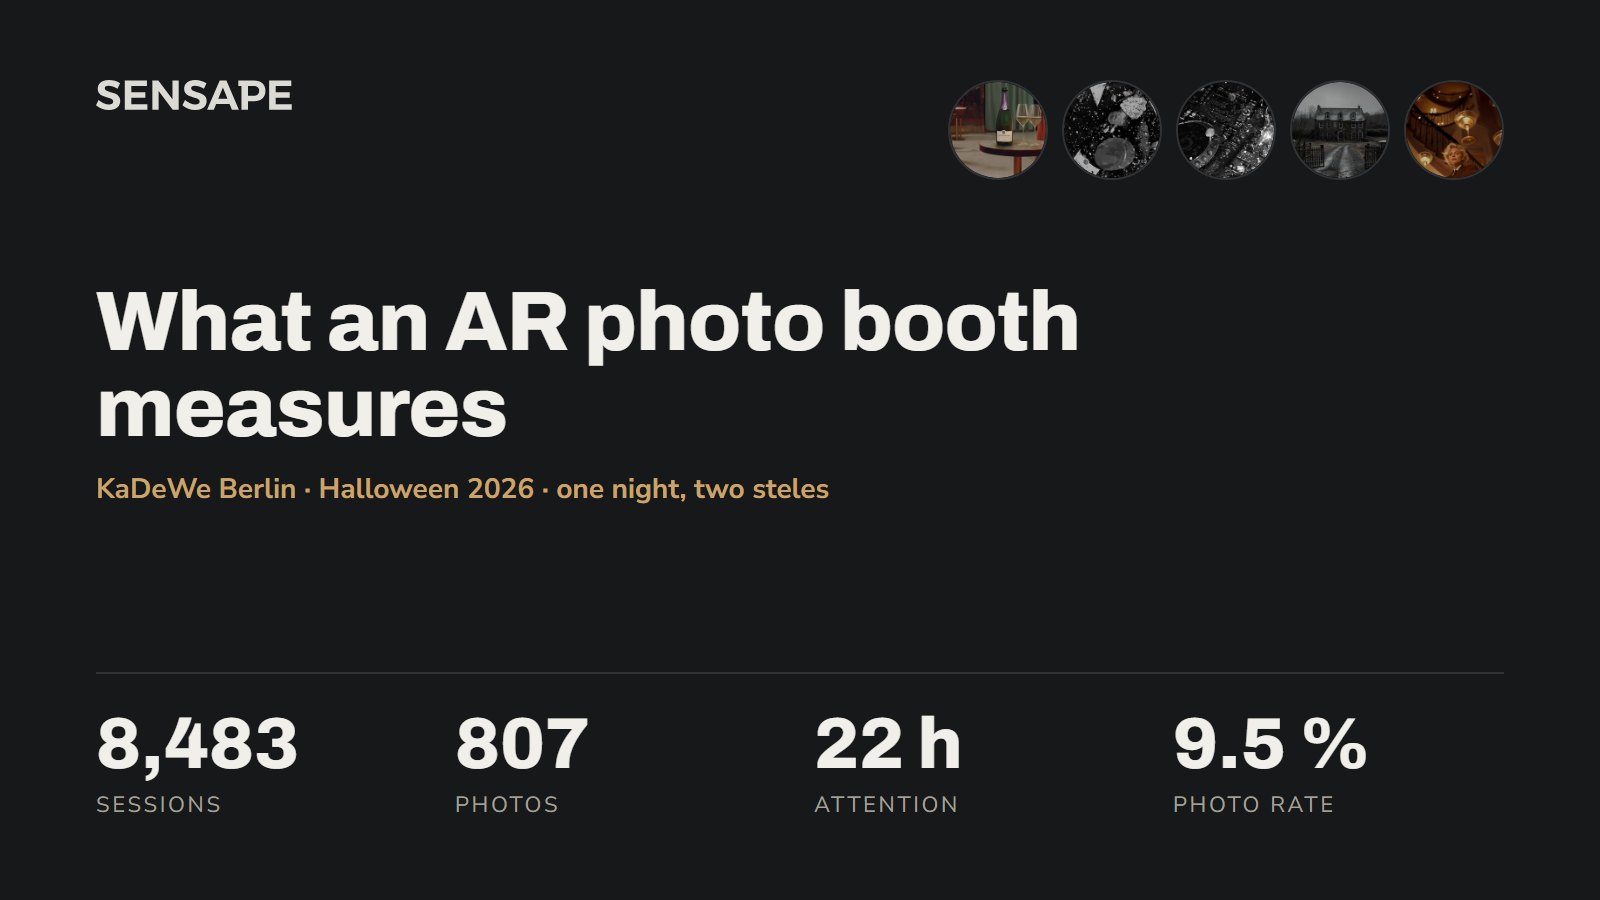
Short answer: A SENSAPE Phantastic Portal counts every person who stops in front of it, how long they stay, which AR world they pick, how many photos they take and how those photos leave the booth (QR code, print, newsletter sign-up). It also estimates age group and gender anonymously. At KaDeWe Berlin on Halloween 2026 that added up to 8,483 sessions, 807 photos and 22 hours of attention in one night.
Most event activations end with a gut feeling: "It was busy." We think brands deserve more than that. So here are the numbers from three activations in autumn 2026: the Landwirtschaftliches Hauptfest in Stuttgart, Baden-Württemberg's big agricultural fair, for the Landesbauernverband (the state farmers' association), a store opening on Berlin's Kurfürstendamm and Halloween at KaDeWe. For each number we explain what it tells a marketing team.
Which events are these numbers from?
| Landwirtschaftliches Hauptfest Stuttgart (Landesbauernverband BW) | Store opening, Kurfürstendamm Berlin | KaDeWe x Taittinger, Halloween | |
|---|---|---|---|
| Date | 26 Sep – 4 Oct 2026, 9 days | Thursday, 29 Oct 2026, approx. 17:25–22:20 | Saturday, 31 Oct 2026, approx. 18:00–03:00 |
| Setup | 1 Phantastic Portal with printer, incl. an AI world (Portal Pro) | 1 Phantastic Portal with printer | 2 Phantastic Portal steles: party area and food hall |
| Sessions | 56,195 | 1,694 | 8,483 |
| Average time in front of the screen | 8.5 s | 7.9 s | 9.3 s |
| Total attention | 131.9 hours | 3.7 hours | 22.0 hours |
| Photos | 3,857 | 150 | 807 |
| Photos per session | 6.9 % | 8.9 % | 9.5 % |
| QR codes shown | 3,830 (99 % of photos) | 150 of 150 | 808 successful downloads |
| Prints | 5,126 copies from 2,710 print jobs | 112 | no printer in this setup |
| Newsletter sign-ups | not part of the campaign | 12 | not part of the campaign |
A session is one person the camera picks up in front of the screen. Someone who walks away and comes back counts again.
What data does an interactive photo booth deliver?
The Phantastic Portal reports six kinds of data per device, per day and per hour, all in our campaign analytics in Phantastic Studio:
- Reach: sessions, i.e. how many people stood in front of the screen.
- Attention: time in front of the screen, per session and in total.
- Engagement: start screen triggered, AR worlds browsed and picked.
- Output: photos, print previews, print jobs, copies, QR codes shown and scanned.
- Leads: newsletter or email opt-ins, if the campaign asks for them.
- Audience: age group and gender, estimated anonymously and reported only as totals, fully GDPR-compliant (how our recognition protects privacy).
Each number answers a question your team already has. Here is how.
How do I know if my activation reached enough people?
Count sessions and attention time, not footfall estimates. Over nine days at the Landwirtschaftliches Hauptfest, one booth picked up 56,195 sessions, about 6,200 a day, and visitors spent 132 hours in front of the screen. At KaDeWe, two steles picked up 8,483 sessions in about nine hours, and guests spent 22 hours in front of the screens. That figure is comparable to media: one night, 22 hours of people actively looking at your brand.
How do I know if people actually engaged?
Look at the share of sessions that end with a photo. Across the three events it ranged from 6.9 % to 9.5 %, so roughly one photo for every ten to fifteen people in front of the screen. That gives you a benchmark for the next event. If a placement falls well below it, the location or the call to action needs work.
The party stele at KaDeWe converted best (10.4 %), ahead of the food hall (8.7 %), even with fewer people walking past. Guests there also browsed far more: 661 world selections against 125 in the food hall, for nearly the same number of photos. People who are in party mode play longer.
Which creative works best?
The world selection shows you which motif guests choose when they have the choice, and how often a choice turns into a photo.
The clearest result came from the Landwirtschaftliches Hauptfest. Of its four worlds, the AI world "Heldenhof" (Portal Pro) turns guests into comic characters on a farm with superhero animals, and guests then pick their favourite picture. It carried 52 % of all photos and 58 % of all prints. Almost every time someone picked it, a photo followed (2,034 selections, 2,003 photos). The abstract world "Farbenspiel" was picked 772 times but only led to 205 photos.
Position in the carousel matters less than you might think. At the store opening the first world won with 70 %, because guests decided fast. At the Landwirtschaftliches Hauptfest the AI world in second position won, and at KaDeWe the haunted house in fourth position took 34 % of all selections. Once people start browsing, a strong motif beats position. For the next campaign that means: put your strongest motif first, and expect an AI world to pull more photos and prints than a classic filter.
When should staff, promoters or the DJ be on?
The photos-per-hour and per-day curves tell you when your audience is there. At the Landwirtschaftliches Hauptfest, weekdays brought 400 to 440 photos a day. Saturday 3 October, a public holiday, and Sunday 4 October brought 620 and 600, around 45 % more. At the store opening the peak was between 19:00 and 21:00. At KaDeWe it built from 21:00 and peaked at midnight with 161 photos in one hour. The food hall went quiet after 1:00 while the party stele kept going until almost 3:00.
So you can plan promoter shifts, paper and print supplies, product sampling or a DJ set around real peaks. In a multi-device setup you can also see which spot carries the late hours.
Did we reach our target group?
The anonymous audience estimate answers that per event. At the Landwirtschaftliches Hauptfest almost one in five sessions (19 %) was under 20, far more than in Berlin (7 %), and the gender split was the most balanced of the three events at 54 % / 46 %. That is what a family audience looks like in the data. At the store opening half of all sessions were people aged 20 to 29. At KaDeWe four out of five were between 20 and 39, led by the 30 to 39 group (42 %). There the gender split was 59 % / 41 % and 62 % / 38 % male to female. If your brand targets a different group, you see it the next day, not weeks later in a survey.
Does the content actually leave the event?
Yes, and you can count it. At the Landwirtschaftliches Hauptfest 70 % of all photos were printed, with an average of 1.9 copies per print job, so 5,126 prints went home with visitors. The AI world reached a print rate of 76 %. At KaDeWe 808 QR downloads went through without a single upload error, and at the store opening 12 guests signed up for the newsletter. A printed photo ends up on the fridge. A QR download ends up in a camera roll and often on social media. Either way, your brand stays with the guest after the event.
How fast do I get the report?
All data is collected in Phantastic Studio. We turned the Berlin events above into a customer report the next working day, with every number broken down by device and hour, and for multi-day events by day and world. A few photos can arrive in the cloud later when the venue's network is slow, so final counts can move by a handful.
FAQ
What does a photo booth measure at an event?
A SENSAPE Phantastic Portal measures sessions (people in front of the screen), time spent, AR worlds picked, photos, prints, QR downloads, newsletter opt-ins and an anonymous estimate of age group and gender, per device, per day and per hour.
What is a good conversion rate for an event photo booth?
In three SENSAPE activations in autumn 2026, 6.9 % to 9.5 % of all sessions ended with a photo. A stele in a party area reached 10.4 %.
Do AI photo worlds perform better than classic AR filters?
At the Landwirtschaftliches Hauptfest in Stuttgart (Landesbauernverband Baden-Württemberg) the AI world (Portal Pro) carried 52 % of all photos and had the highest print rate, 76 % against 56 % to 67 % for the classic worlds.
How many photos get printed?
With a printer on site, 70 % of all photos were printed at the Landwirtschaftliches Hauptfest, at an average of 1.9 copies per print job.
Is the audience data GDPR-compliant?
Yes. The data is anonymous and GDPR-compliant: age group and gender are estimated anonymously by the device and reported only as totals per hour or event. The report contains no names or faces of passers-by.
Can I compare several locations or devices?
Yes. Every device reports separately, so you can compare placements side by side, as with the party stele and the food hall at KaDeWe.
Which SENSAPE products deliver this data?
The data described here comes from the Phantastic Portal (AR photo experience) and Portal Pro (AI photo worlds). Other SENSAPE experiences run on the same Phantastic Studio platform; ask us which metrics your format supports.
Planning an activation and want numbers like these afterwards? Talk to us.
About SENSAPE
SENSAPE GmbH, headquartered in Leipzig, has developed interactive AR and AI brand experiences since 2015. Core products: Phantastic Portal, AR Games, Allstars, WebAR, Virtual Try-On and AI Avatars. Clients include FC Bayern München, Paris Saint-Germain, Disney, Porsche, Coca-Cola and Toyota. See selected campaigns in the projects overview.